Our Motivation
California's Central Valley is characterized by a Mediterranean climate, with hot, dry summers and mild winters. However, the region has been increasingly impacted by extreme heat events, particularly during the summer months. Temperatures can soar well above 100°F (38°C) for extended periods of time, creating significant health risks for residents, especially in urban areas where the effects of heat are intensified.
The Central Valley is also one of the most agriculturally productive regions in the United States, yet its economy and infrastructure often struggle to adapt to the rising temperatures exacerbated by climate change. The impacts of extreme heat are felt disproportionately by disadvantaged communities, where socioeconomic factors limit access to resources and protective measures. These communities often experience higher rates of heat-related illnesses and mortality, making the issue of extreme heat a critical public health concern.
One key factor in mitigating the impacts of extreme heat is access to shade. Green spaces, trees, and vegetation provide essential cooling effects that can lower surface and air temperatures, reduce energy consumption, and improve air quality. However, many neighborhoods in the Central Valley lack sufficient tree cover and green infrastructure. This absence of shade contributes to the development of urban heat islands, where built environments absorb and retain heat, further increasing temperatures in already vulnerable areas.
Research has shown that access to shade can significantly improve health outcomes by lowering the risk of heat-related illnesses, promoting outdoor activity, and enhancing overall quality of life. Unfortunately, the inequitable distribution of trees and green spaces often leaves marginalized communities without adequate protection from extreme heat. Efforts to increase urban greening, enhance shade access, and develop heat resilience strategies are essential for addressing these disparities and promoting social equity.
Our Approach
We utilized a unique set of geospatial tools to estimate shade, and overall temperature within microclimates during extreme heat events. We also measure the disproportionate impact of extreme heat on disadvantaged and environmental justice communities. The data we used were Socioeconomic Date from the American Community Survey
2020 LiDAR data from USGS and FEMA for the San Joaquin Valley, land cover data, thermal infrared remotely sensed imagery, multispectral Landsat 9 imagery, and weather station data.
We leveraged R studio for cleaning, analyzing, running statistical tests, and data visualization, ESRI's ArcGIS Pro LAStools to process shade and Digital Surface Models from the LiDAR point clouds, and SOlar and LongWave Environmental Irradiance Geometry model (SOLWEIG) to estimate the mean radiant temperature (MRT) for extreme heat event days.
The InVEST Urban Cooling Model takes a number of biophysical inputs including; building intensity, tree canopy, evapotranspiration, land cover, and temperature. For our two-city analysis, we collected this data from a variety of sources listed in the data acquisition sections and below (Table 2). Building footprint data were derived from Bakersfield and Fresno GIS repositories in order to extract building intensity values which is the ratio of floor area to land cover area yielding a value between 0 and 1.
Finally, we used the InVEST (Integrated Valuation of Ecosystem Services and Tradeoffs) Urban Cooling Model from Stanford’s Natural Capital project can be utilized to highlight opportunities for prioritization of UHI heat mitigation measures throughout Fresno. The InVEST urban cooling model generates a heat mitigation index (HMI) based on the cooling capacity (CC)of each cell (as defined by the local environmental properties within the cell of shade, evapotranspiration, albedo, and building intensity) and its proximity to green areas. For daytime, the CCday is a function of shade, albedo, and evapotranspiration index (ETI) (equation 1). ETI is defined as the ET rate of the cell divided by the maximum ET rate in the study area. Note that all three variables in Equation 3 take on values between 0 and 1. For nighttime, the CCnight is a function of building intensity (equation 4) since nighttime temperatures are driven by heat release from buildings and impervious surfaces (Ferreira and Duarte, 2019). A third cooling capacity index (CCPG) is generated by InVEST and values cells based on their proximity to green areas. It has been shown that green areas must be bigger than 2 hectares to have a cooling effect on the air around them (MacDonald et al. 2016; Zardo et al. 2017). CC-PG is the sum of the cooling contributions from all nearby green areas with each contribution depending on the CC of the green area and the distance from the cell. The daytime HMI assumes a larger value between CC-day (CC-night) and CC-PG. With the above definitions, HMI takes on values between 0 and 1.
In order to model planning scenarios, adjusting the biophysical parameters of shade and albedo is necessary. For example, to model a 5% increase in the tree canopy (i.e. from 10% to 15%) the shade values in the model parameters would be increased for development land covers (i.e where it would be feasible for the municipalities to add trees) such as road right of way, public spaces, and residential categories. It’s important to note that while increasing shade represents an increase in the tree canopy, this does not affect the prevalence or influence of “green spaces”. In addition, since nighttime HMI is dependent only on building intensity and since model runs did not change the existing land use, only nighttime model runs represent existing conditions.
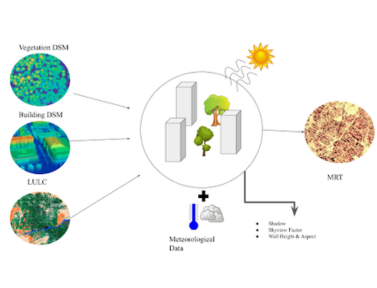
Workflow of generating Mean Radiant Temperature (MRT) using building and tree digital surface models, land cover and meteorological parameters.
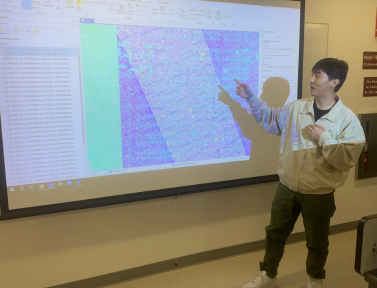
Euichan Seo explains the LiDAR point clouds and how they are used to process shade.
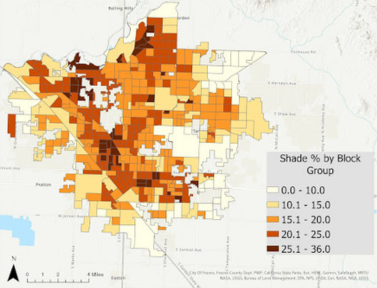
Shade amounts per block group throughout Fresno, California.
Our Results
We found in our analysis that severely disadvantaged communities had significantly higher temperatures than non-disadvantaged communities (0.6-2.5°C Warmer). We also ran an analysis of Variance (ANOVA) which showed no significant difference between shade amounts in disadvantaged communities, severely disadvantaged communities, and non-disadvantaged communities. However, tree shade was found to be more abundant in non-disadvantaged communities.
Latino/a neighborhoods were also found to be statistically significantly warmer than non-Latino/Latina neighborhoods. We also compared Land Surface Temperature (LST) to Mean Radiant Temperature and found LST overestimated actual temperature compared to MRT.
Finally, we found that increasing albedo and tree canopy had substantial cooling impacts. The majority of impacts were in disadvantaged communities that had a severe lack of tree canopy to begin with. Our model showed cooling effects of up to 8 degrees C.
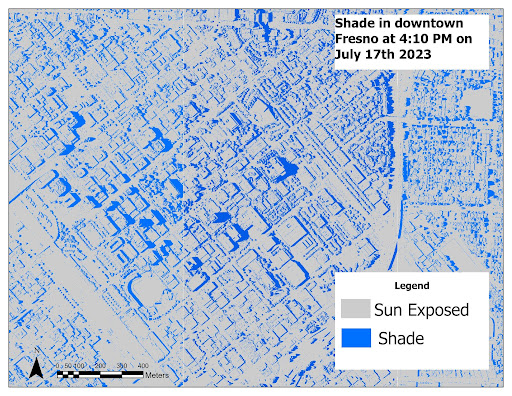
Distribution of shade in downtown Fresno during the warmest hour of 2023
Shade from mid to high-rise buildings was the largest source of shade accounting for 65% of overall shade with trees providing just over 31%.
Figure by Jake Dialesandro and Euichan Seo.

Mean Radiant Temperature aggregated to the block group level throughout Fresno during an extreme heat event
The warmest temperatures were found in predominantly Latino/Latina neighborhoods as well as low-income neighborhoods.
Figure by Jake Dialesandro, Euichan Seo and Iris Stewart-Frey.
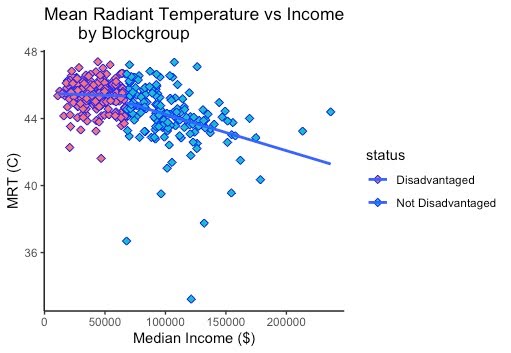
Statistical relationship between temperature and income throughout Fresno
Scatterplot demonstrating the relationship between mean radiant temperature and income throughout Fresno. The relationship was significant with a p-value <0.0001. Additionally, the 10% most wealthy block groups had a mean radiant temperature average of 42.3 C, while the block groups with the lowest 10% of income had an average temperature of 46.3 C.
Figure by Jake Dialesandro and Euichan Seo.
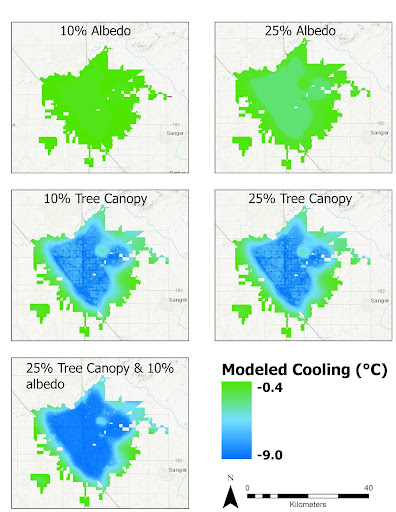
Modeled cooling potential of planning interventions in Fresno of increasing shade, tree canopy, and albedo
Cooling potential of planning interventions reached up to 8-9 degrees C by increasing Tree Canopy between 10 and 25% throughout Fresno. Increasing albedo had a much smaller cooling effect between 0.5-1.5 degrees C.
Figure by Jake Dialesandro, Euichan Seo and Iris Stewart-Frey.